Daily Chart
Weekly Chart
Yearly Chart
Monthly Usage Chart
Ypsilanti Food Coop Details
Ypsilanti Food Coop Files
This chart is showing utility meter data from today. The 'Inflow Meter' line is the amount of power that is being purchased from the power grid and the 'Outflow Meter' line is the amount of power being sold back to the power grid. The 'Generation Meter' shows the amount of power that is being generated by the solar panels on the roof of the building. Each data point on the chart is the summation of the data over a five minute period.
This chart is showing the total amount of electricity that is being used and where it comes from. When the line is red, it means that all of the electricity being used is being purchased from the power grid. When the line is orange, it means some of the power is being purchased from the power grid and some is being supplied for free. The free power will usually come from the solar panels on the roof. If the line is green, it means that all of the electricity being used is free. This means that either all of the electricity is coming from the solar panels or the electricity being brought in from the power grid is less than the amount of power we have exported to the power grid in the past. When the black line is visible it is showing the amount of excess power that is being exported to the power grid.
The 'Sunrise' and 'Sunset' times are provided by Yahoo! Weather RSS and the 'Local Noon' line is the time when the sun is highest in the sky. On a sunny day, this should be the time when the solar panels are generating the most electricity.
This chart is showing utility meter data from the last week. The 'Inflow Meter' line is the amount of power that is being purchased from the power grid and the 'Outflow Meter' line is the amount of power being sold back to the power grid. The 'Generation Meter' shows the amount of power that is being generated by the solar panels on the roof of the building. Each data point on the chart is the of all data over a one hour period.
This is a rolling chart that will always display the last 168 hours (7 days) of data. The '|' markers on the chart indicate midnight between two days.
This chart is showing utility meter data from the last year. The 'Inflow Meter' line is the amount of power that is being purchased from the power grid and the 'Outflow Meter' line is the amount of power being sold back to the power grid. The 'Generation Meter' shows the amount of power that is being generated by the solar panels on the roof of the building. Each data point on the chart is the of all data over a one day period.
This is a rolling chart that will always display the last year of data. The '|' markers on the chart indicate the separation of two months.
This chart is showing the monthly electricity usage of the location. The red part of the bar is the amount of electricity purchased from the electricity grid. The yellow part of the bar is the amount of electricity that was generated by the solar panels and used by the location. The green part of the bar is the amount of electricity that was generated by the solar panels and was exported to the electricity grid for credit.
This is a rolling chart that will always display the last 12 months of data.
Installation Type: Private
Upgrade Completed: 2009
Number/Type of Solar Panels: 12 Sanyo HIT 190 watt
Angle/Direction of Solar Panels: 38° facing South
Size/Type of Inverter: Sunny Boy 2100 watt
Installer: SolarYpsi Volunteers
Rated Output: 2.38 KW
Contact: Ypsilanti Food Cooperative
Images (Click on an image for a larger view)
The front door of the Ypsilanti Food Cooperative
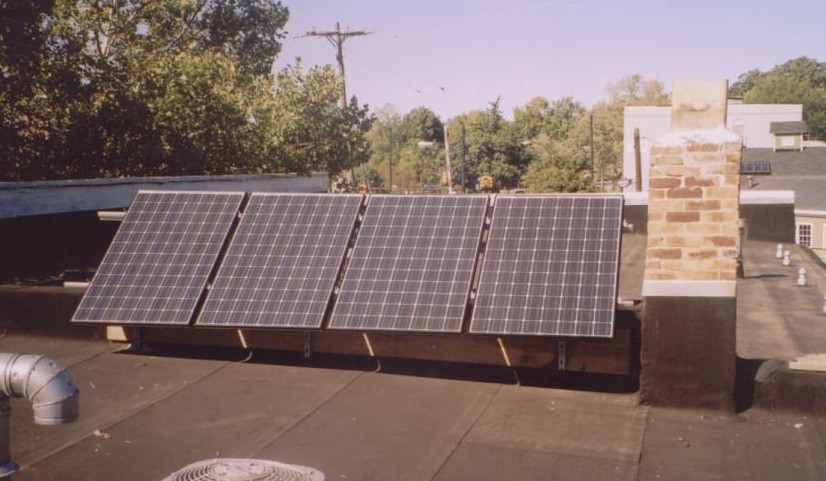
The first four panels that were installed.
The fifth panel installed and all panels on the structure that will have 12 panels installed on it.
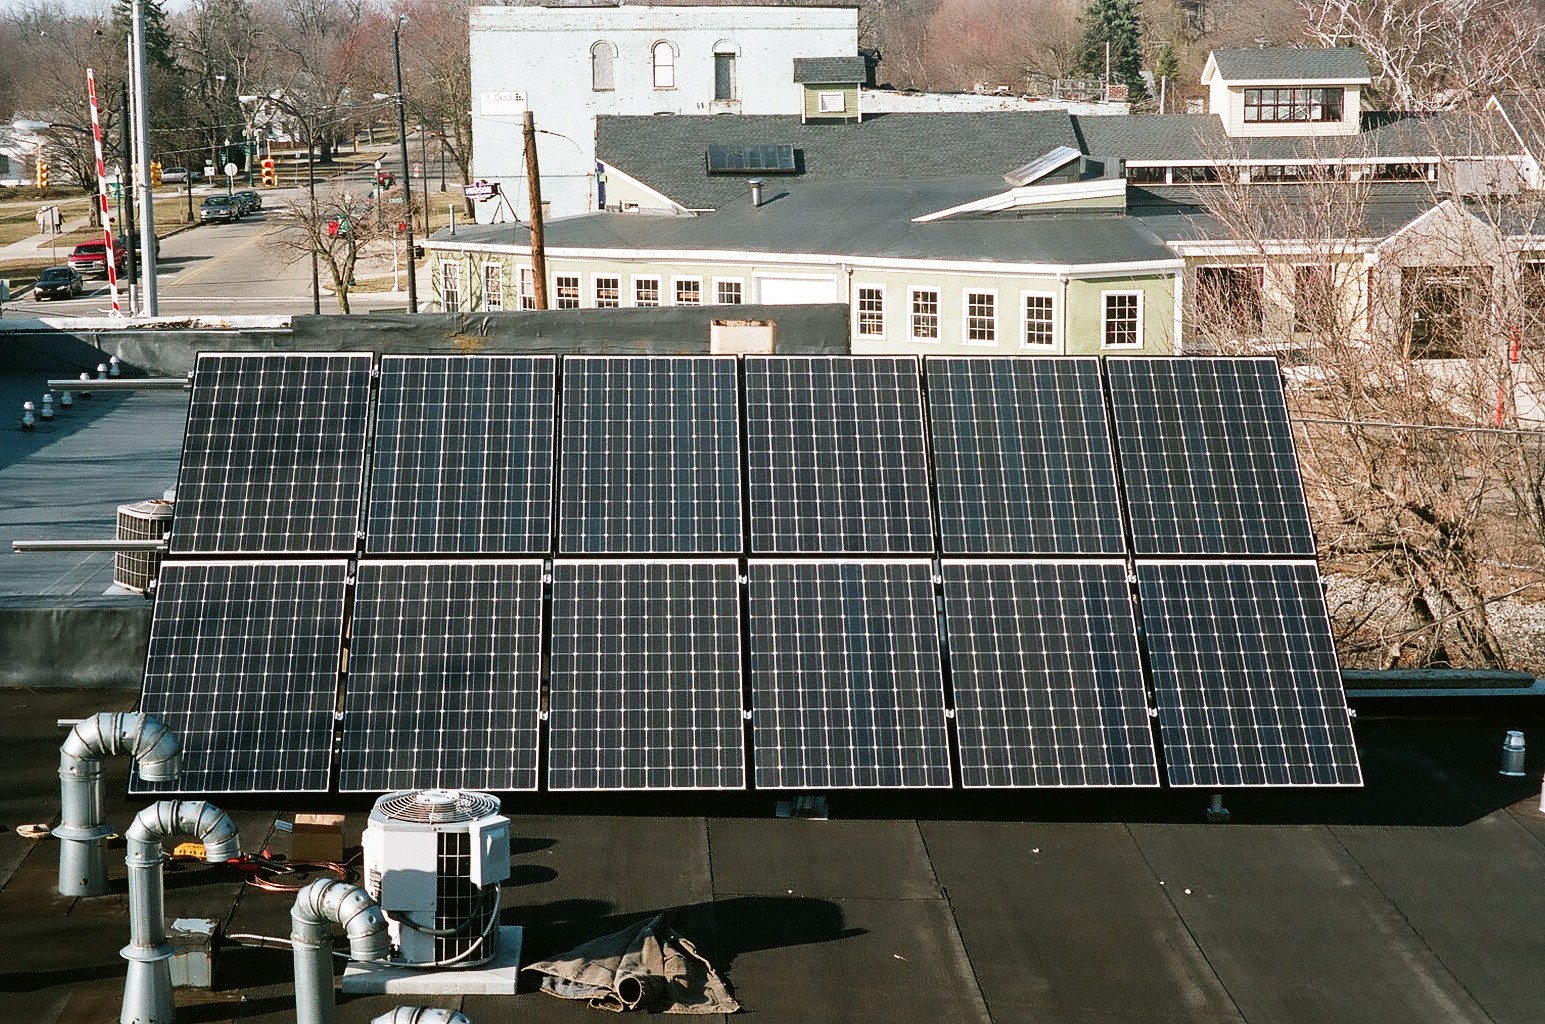
All 12 panels installed.
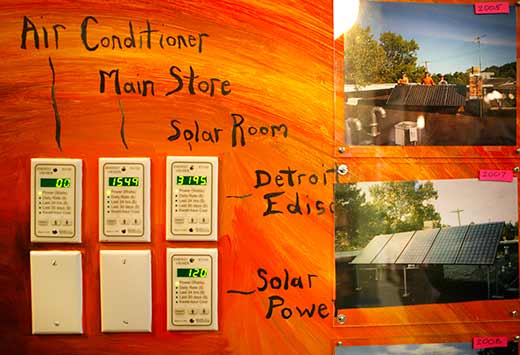
Meters on a wall in the Cooperative showing what is being used from DTE and what is being generated by the solar panels.
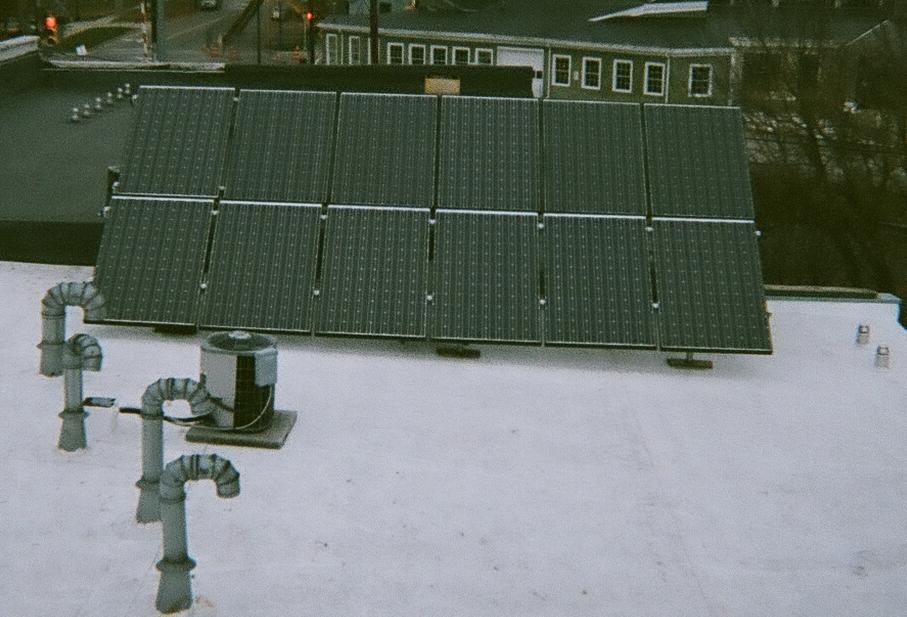
All 12 panels installed with the new white roof.
Ypsi Food Co-Op Solar Trifold
Sanyo HIT 190 watt Solar Panel
Sunny Boy 2100 watt Inverter
Ypsi Food Co-Op Solar Proposal
Ypsi Food Co-Op Final Report
Ypsilanti Food Co-Op Expansion Report
2008 RFP
PSC_08_31_Report_2008_08.pdf
PSC_08_31_Report_2008_10.pdf
PSC_08_31_Report_2008_12.pdf
PSC_08_31_Report_2009_02.pdf
PSC_08_31_Report_2009_04.pdf
PSC_08_31_Report_2009_06.pdf
PSC_08_31_Report_2009_08.pdf
PSC_08_31_Report_2009_10.pdf
PSC_08_31_Report_2009_12.pdf
PSC_08_31_Report_2010_02.pdf
PSC_08_31_Report_2010_04.pdf